Hello again, Readers!
These summer months are really flying by, and it appears I am quickly approaching the mid-point of my internship. So here’s a brief (and hopefully informative/mildly entertaining) update.
In case you forgot…..
This summer I am interning at the New Orleans Regional AIDS Planning Council (NORAPC). This group is a federally mandated planning body that brings together members of the affected community with health officials to plan how millions of federal dollars are spent for HIV/AIDS care. (Really interested? Read in more detail from my last post down the page).
What have you been up to this past month?
I have been busily working under NORAPC’s Health Planner, Erika Sugimori, to prepare seriously in-depth data packets and presentations for the Council’s annual priority setting session (PSS). These packets are no joke. They are over 100 pages long and contain graphs, charts, tables and explanations of 2013-14 HIV/AIDS related data that is hot off the press from the Mayor’s Office of Health Policy, the City Health Department, the Center for Disease Control, the Kaiser Family Foundation and many more
As a public health student I find this extensive and up-to-date data exciting. In the internship world “data entry” has a pretty bad rap for being boring, uneducational and unglamorous. While there’s no debating the unglamorous part, I would have to disagree with the rest. By actually reading and analyzing the data I am entering I have learned so much about HIV and the infrastructure the greater New Orleans area has in place to tackle it. I’ve been able to see the vast improvements NOLA has made in HIV/AIDS care since Hurricane Katrina but also the multitude of areas for continued growth. I am also lucky to have a supervisor who is both extremely knowledgeable and excited to answer my questions.
No offense…but there’s no way everyone likes reading this data as much as you, Maggie
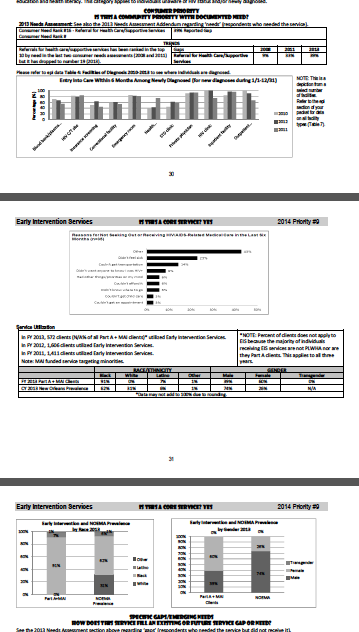
You’re absolutely right! That has been one of the issues we have been working on, presenting the data in a way that is informative, reader-friendly and not overwhelming. The packets contain a lot of graphs and some data presented in tables and in visual forms.
^^^Pages from PSS packet, data presented in a many different formats
It’s been really great practice looking at the data from this reader friendly perspective. In my opinion, one of data’s best uses is to inform policy and decisions. It is essential, however, that the data is presented in a logical and understandable manner to the general public and non-health experts in order for it to be most effective. These data translation skills I have been practicing are definitely skills I plan on utilizing in the future.
Well, did it work?!? Could other people understand/appreciate the data?!!
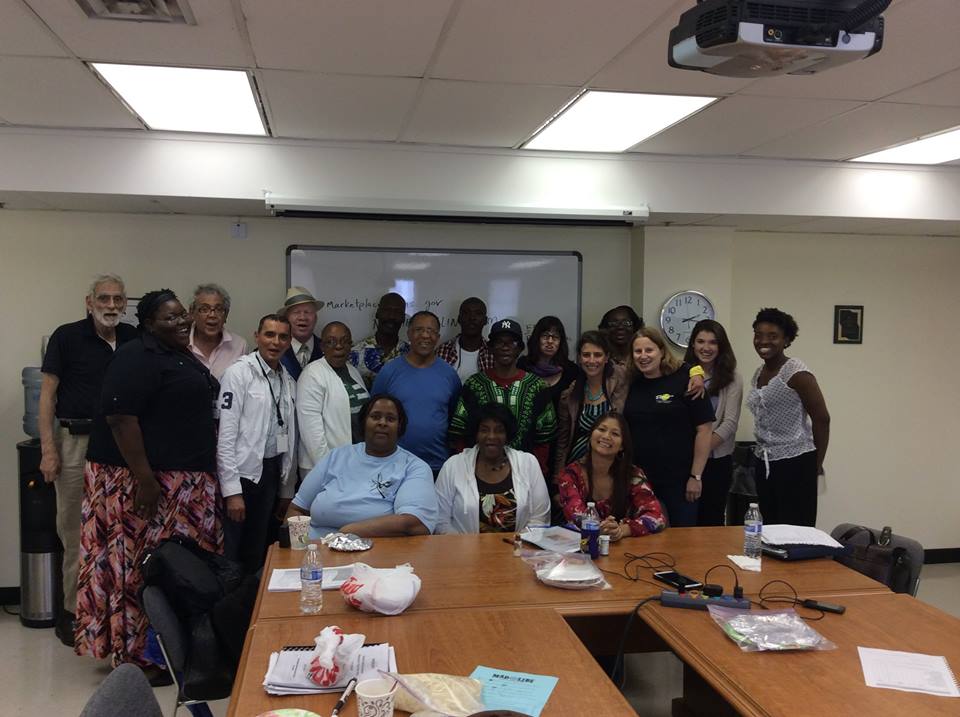
Yes! I really think it did. Last Saturday (7/19) was NORAPC’s annual Priority Setting Session. At this session, the council and any interested community members come together for a day-long event of discussing and prioritizing. The Ryan White legislation lists 30 categories relating to HIV/AIDS that can potentially be funded by the federal money. At this meeting, it is up to the council to vote, score and eventually prioritize these 30 categories in what they believe are the greatest needs facing the New Orleans HIV/AIDS community (sneak peak! In August the council gets to decide how much money will be allocated towards each priority, stay tuned!!).
^^ Members of the Planning Council at the PSS
You could just tell, the Council was jazzed about the data! They were asking question after questions, constantly flipping through their data packets, commenting on successes and failures. It was great to see! It was also exciting to hear members of the council combine or refute what the data was indicating with their lived experience as a member of the HIV community.
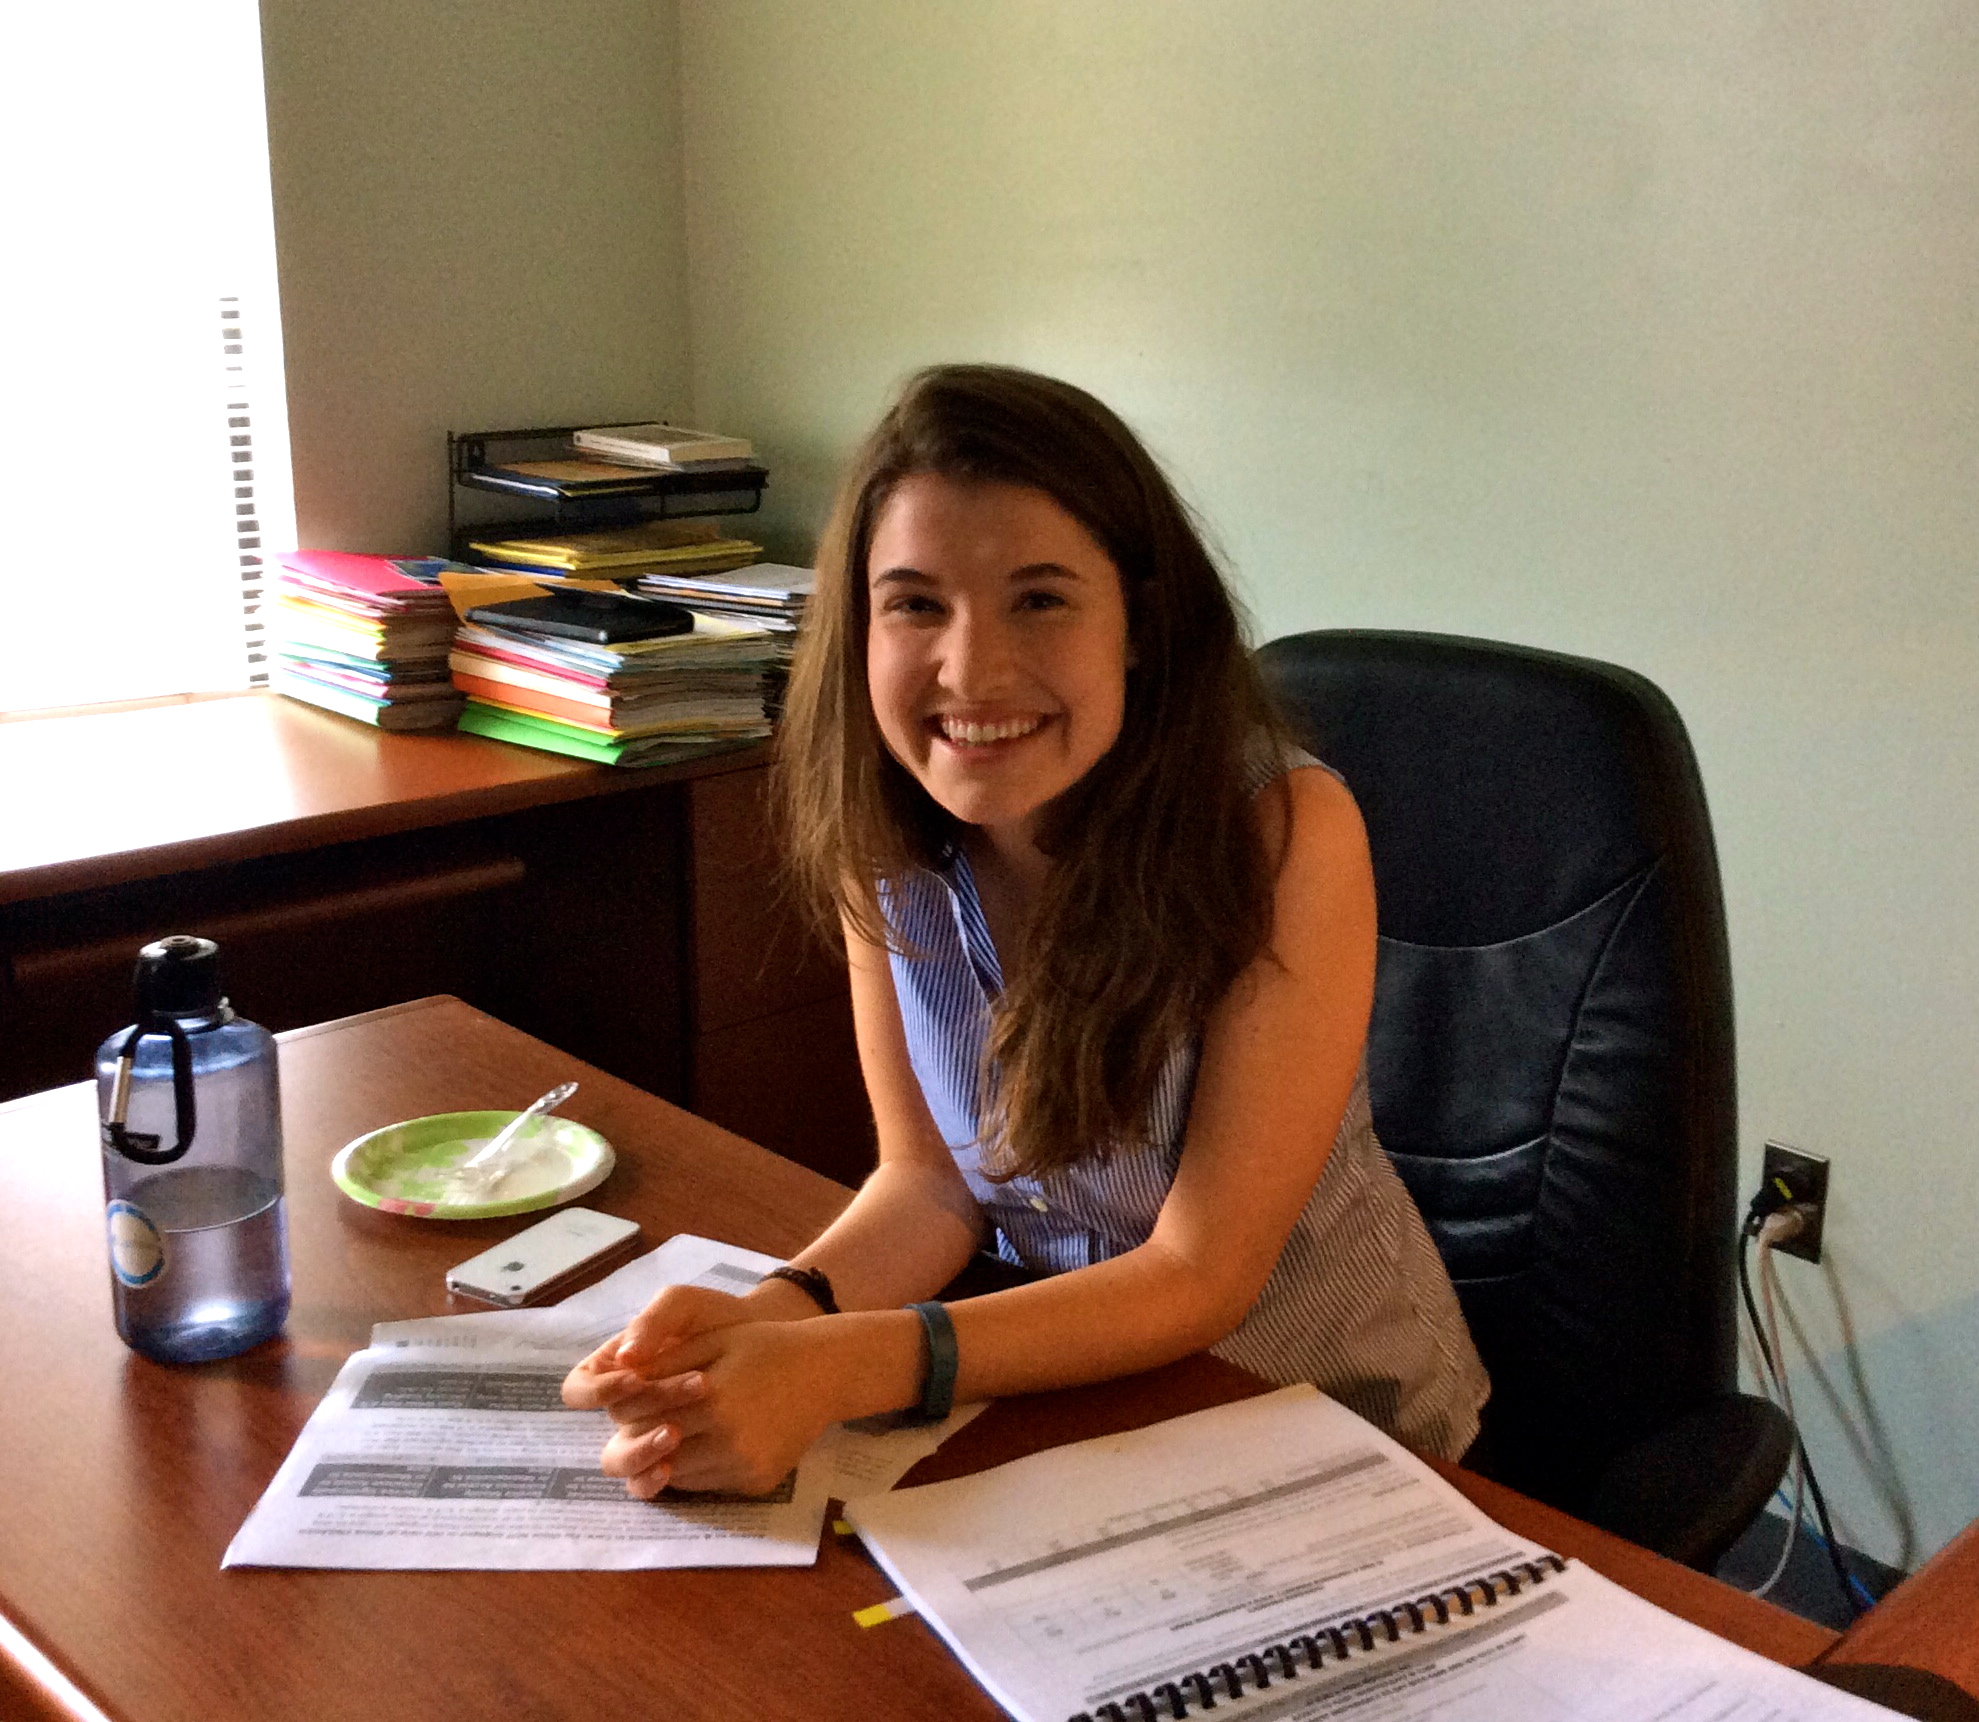
I worked with a group to record their voting on the issues. It was good to have the opportunity to add to their discussion by pointing out pertinent data points but it was also a great privilege to be able to hear and learn about the challenges and successes these individuals have had living with this disease. Many have overcome much adversity over the years, and I was truly inspired by their courage and commitment. I was honored to be able to learn from and interact with a group of individuals who were so dedicated and passionate about bettering the lives of their community.
^^ Me tracking the votes of the meeting
Final thoughts?
Though this process takes a lot of preparation and coordination, I firmly believe this process is one of the best ways of deciding how funds are allocated and spent. It seems rather obvious that you should ask the opinions of the individuals the funds will be spent on, but I feel it so rarely happens. By combining lived experience, with epidemiological data and bringing together individuals of the affected community with community organization leaders and health officials, you are about to paint the fullest and brightest picture of what is really needed for community improvement. Hopefully spending will be maximized, and the community will continue to be empowered to advocate and work towards bettering the lives of those with HIV/AIDS in New Orleans. This has been an exciting, challenging, and rewarding means of making informed health decisions.
That’s all for now! Thanks for reading,
Maggie Herman


